


▶ 간편한 조작
▶ 모든 중요한 기능들은 대시보드를 통해 검색할 수 있습니다.
▶ 전역 설정 : 단위를 조정하고, 소수 자릿수를 변경하고, 회사 이름과 로고를 저장하십시오.
▶ 실시간 데이터 가져오기 : CS 로거 또는 센서에 이더넷 연결을 설정합니다. 그래픽 및 표 형식으로 실시간 측정 데이터 추적 가능합니다.
▶ CS Soft Basic에서 가져 오기 : CS Soft Basic의 이전 버전에서 데이터 이동
▶ 데이터 백업 : 프로젝트 및 데이터 베이스 백업
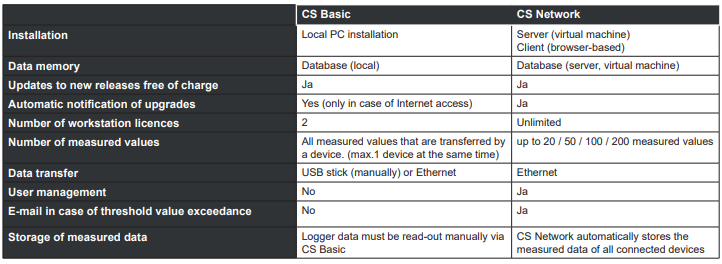
※ For industry and laboratory application only
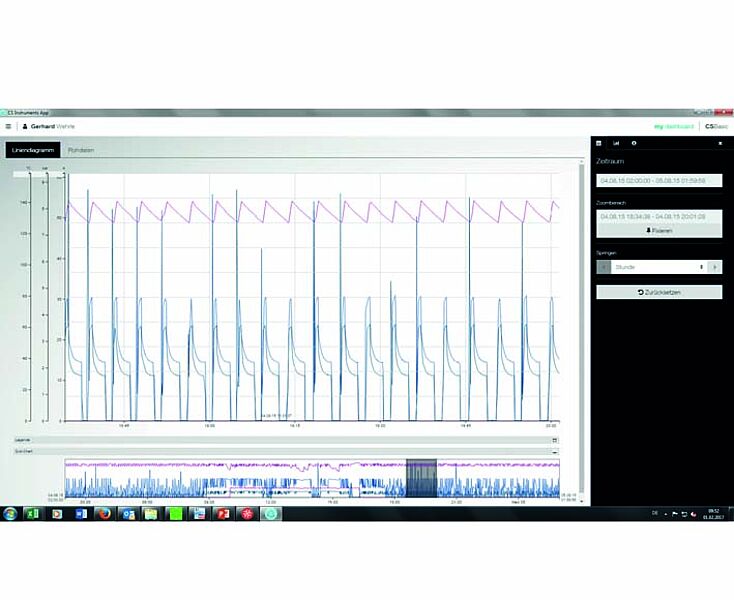
► Graphic evaluation
All measurement curves are indicated in colour. All necessary functions are integrated, such as free zoom, selection/deselection of single measurement curves, free selection of periods, scaling of the axes, selection of colours and so on. Different data can be combined in a shared file. This view can be saved as a PDF file and sent as an e-mail.
► Table view
All measuring points are listed with exact time interval. The desired measuring channels with the name of the measuring place can be selected via the diagram explorer.
► Statistics
All required statistic data are visible at a glance. So the user can see very quickly which minimal or maximal measured values occurred when and for how long.
► Flow evaluation
The software carries out flow analysis for all connected flow meters, optionally as a daily, weekly or monthly analysis.
► Data export according to MS-Excel® or csv
The measured data can be exported to Excel or csv.
► Rates
The price per consumption unit can be can be stored for each energy form. Depending on the time and day, different tariffs can be stored. The validity of the tariffs can be defined via calendar function so that price increases or decreases can be updated.
► Multilingualism
The user interface is included in German, English and further languages in the scope of delivery.
► Alarm history / Alarm log file
The threshold value exceedance is documented with the CS Network.
► Management of the measuring sites
Each CS sensor or each CS chart recorder can be assigned to a department/hall (or cost centre).